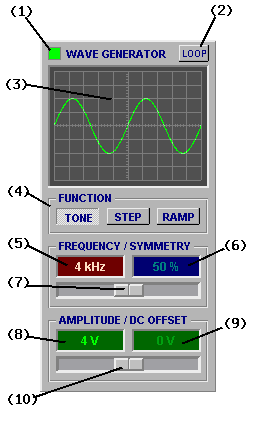
Some BitScope models have a built-in waveform generator selected via the AWG instrument.
The Waveform Generator panel controls the operation of the waveform generator with parameters that will be familiar to those who have used a standard waveform generator before.

It allows the selection of a function type and wave shape (symmetry), frequency, amplitude, and offset at which it is to be synthesized.
(1) Capture LED illuminates when the waveform generator is active.
(2) Generator Mode selects whether to produce continuous waveform or one-shot waveforms.
(3) Waveform Preview displays generated waveform in preview.
(4) Wave Function selects the function used to synthesize the waveform (ie, wave shape).
Parameters are divided into two pairs each of which shares a Parameter Control (7) & (10):
(5) Frequency waveform frequency.
(6) Symmetry applies optional symmetry modifications to the wave shape.
(8) Amplitude adjusts amplitude.
(9) Offset adjusts DC offset.
How the waveform generator works in detail depends on the BitScope model used but they all work the same way in princple; they upload a waveform to the logic capture buffer which then replays it.
Because the logic buffer is used by the waveform genertor, concurrent logic capture is not possible.

The AWG is effectively a very high speed "sample replay engine" so the actual waveform can be completely arbitrary (within the sample rate and hardware limits of the device) and in most models simultaneous waveform capture also is possible allowing transfer function analysis, one of BitScope's most powerful features.
Some BitScope models also have a front panel AWG switch ->
In addition to selecting AWG these models require this switch to be in the ON position (as shown) for the waveform generator output to be available at the Channel B BNC connector.
This can be very useful as it switches Channel B from being an AWG output to a DSO input so with the switch off you can see whether the circuit to which you are connecting the waveform generator has any other signals, offsets or noise already present and if all is well switch it on to apply the waveform to the circuit.
Note that the AWG output is terminated in 50 ohms and an alternative waveform generator output is available on pin 26 of the POD connector (some models) regardless of the switch position.
The waveform generator operates in two modes:

One-shot replay with optional REPEAT is the most useful mode when BitScope is used stand-alone.
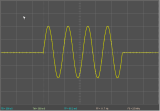
Fig [1] - One-Shot TONE
It plays the waveform once (or many times) as a (repeating) one-shot waveform burst.
For example, Fig [1] shows a four cycle one-shot TONE function.
In one-shot mode simultaneous waveform capture via Channel A is possible and the generated waveform may be viewed on Channel B as it is replayed (ie, as an external oscilloscope would show it).
Generation and capture is synchronised to the waveform burst and any waveform generator parameter may be changed at any time.
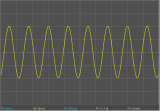
Fig [2] - Continuous TONE
The alternative "Loop Mode" is selected via the Loop Button at the top of the panel.
For example, Fig [2] shows a continuous TONE.
Loop Mode is normally used to produce a continous waveform where BitScope functions as a waveform generator to be used with another oscilloscope or test instrument.
Selecting loop mode precludes simultaneous waveform capture and AWG parameters may not be changed until loop mode is deselected.
The waveform generator includes a mini-scope display for waveform preview.
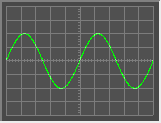
The preview is the same as the main display except it shows the waveform that will be generated not the actual output waveform.
It adjusts according to the timebase and voltage scale so synthesized waveforms appear the same as they do on the main display.
The purpose of the preview is to provide instantaneous visual feedback about what the waveform will look like as waveform generator parameters are changed.
It does this even when the waveform generator is not enabled.
Of course the generated waveform can be recaptured and shown on the main display via its associated analog channel in One-Shot Replay generator mode.
However in Continuous Replay mode (aka Loop Mode) this is not possible so the preview display provides a useful alternative view of the generated waveform in this case.
The first step when programming the waveform generator is to choose a wave function.

The wave function is not the waveform. Rather it is the mathematical function used to synthesize the waveform according the specified wavform generator parameters.
Synthesizes a standard sinusoidal waveform (assuming symmetry of 50%).
![Fig [3] - TONE Wave Function (50%) Fig [3] - TONE Wave Function (50%)](/software/dso/guide/1.3/86.png?m=p)
Fig [3] - TONE Wave Function (50%)
TONE function waveforms are used for tone based circuit analyses including phase response and any other application that requires a single pure frequency.
If the symmetry is set to other than 50% the sinusoid is progressively phase distorted.
Synthesizes a standard square wave (assuming symmetry of 50%).
![Fig [4] - STEP Wave Function (50%) Fig [4] - STEP Wave Function (50%)](/software/dso/guide/1.3/87.png?m=p)
Fig [4] - STEP Wave Function (50%)
STEP function waveforms are used for step and impulse response analysis and general transfer function analysis. If the symmetry is adjusted to other than 50% the mark-space ratio of the square wave can be adjusted. In the extreme you can synthesize a pulse train in this way.
Synthesizes a standard triangle waveform (assuming symmetry of 50%).
![Fig [5] - RAMP Wave Function (50%) Fig [5] - RAMP Wave Function (50%)](/software/dso/guide/1.3/88.png?m=p)
Fig [5] - RAMP Wave Function (50%)
RAMP function waveforms are useful to test system linearity, slew rate measurements or for their unique spectral characteristics. If the symmetry is adjusted to other than 50% the triangle waveform can be transformed into a ramp or inverse ramp (aka sawtooth) waveform.
In addition to the wave function the waveform generator divides the four other parameters (frequency, symmetry, amplitude and offset) into two parameter groups.
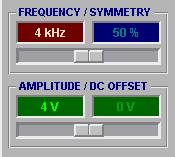
Each group displays the parameter pair and has a shared parameter slider positioned below them.
To change a parameter, click on its value to highlight the parameter and adjust the slider to change the parameter.
As the parameter is changed the waveform preview adjust immediately to reflect the change to the waveform.
It is also possible type in a new value for each parameter.
Click on the parameter to be changed and type in a new value pressing enter to finish.
The value typed may be followed by an optional range character (eg, m, k, M).
For example the value 23.4k entered into the frequency parameter box will change the frequency to 23.4kHz. If no range is entered, units are assumed.
It is also possible to enter a new value with a postfix operator to apply to the parameter value.
For example, if the frequency is 4kHz and 3k+ is entered, the new frequency will be 7kHz.
Likewise entering 2/ will produced 2kHz and entering 10* will produce 40kHz.
As new parameter values are entered, the waveform preview updates immediately to show what the new waveform will look like. If the previewed waveform appears too small or the timebase is inappropriate, simply adjust the associated DSO contols (timebase and/or voltage scale).
The frequency and symmetry are the primary waveform generation parameters.

The frequency is arguably the most important because it sets the fundamental frequency of the waveform. However, when choosing the frequency it is important to understand how it relates to the prevailing capture sample rate.
If the sample rate is too low, the waveform will not be rendered very accurately, particularly when using the TONE or RAMP functions. The STEP function is much less sensitive to this issue but in any case the simplest way to make sure you're using the optimal sample rate is to choose a timebase that results in just a few periods of the waveform being displayed via channel B on the main display in one-shot mode.
See Parameter Control for details about how to view the waveform live.
The symmetry control adjusts the mark-space of STEP functions, the rise/fall ramp rate of STEP functions and the relative time span of each half of TONE functions.
![Fig [6] - RAMP Wave Function (1%) Fig [6] - RAMP Wave Function (1%)](/software/dso/guide/1.3/91.png?m=p)
Fig [6] - RAMP Wave Function (1%)
Fig [6] shows the RAMP function with 1% symmetry; the triangle waveform has been transformed into a sawtooth. Similarly a 1% STEP function (a pulse train) is shown Fig [7].
![Fig [7] - STEP Wave Function (1%) Fig [7] - STEP Wave Function (1%)](/software/dso/guide/1.3/92.png?m=p)
Fig [7] - STEP Wave Function (1%)
Any variation between these extremes is possible.
The amplitude and offset are the secondary waveform generator parameters.

Neither of these controls affects the waveform shape or how it is encoded for replay but they are both very important.
The amplitude controls the waveform generator's peak-to-peak output voltage swing. The largest amplitude possible depends on the BitScope model and to some extent the prevailing offset.
The offset controls the DC offset (if any) applied to the waveform. By default generated waveforms are bipolar; that is they oscillate between negative and positive voltages.
In many situations a unipolar waveform is required, for example a 0 to 5V square wave in which case the offset and amplitude controls together can be used to adjust the output accordingly.
Simultaneous waveform generation and capture facilitates transfer function analysis.
By using waveforms of appropriate shape, frequency and/or spectral characteristics, BitScope can be used to characterize electronic circuits without the need for additional test equipment.
For example you can test impulse, step, amplitude and phase responses directly and using the spectrum analyzer view approximations of the associated transfer functions simultaneously.
![Fig [8] - Tank Circuit Fig [8] - Tank Circuit](/software/dso/guide/1.3/76.png?m=p)
Fig [8] - Tank Circuit
Back in Electronics 101 you no doubt learnt about the LC or tank circuit ^.
We'll use this circuit to explain how to measure step response and view the transfer function.
Fig [8] shows a tank circuit configured to be driven by the built-in AWG (via Channel B) and the response captured via BitScope's Channel A.
If you have a spare inductor and a capactor you can build one easily. A "back of an envelope" construction of this circuit is shown in Fig [9].
![Fig [9] - Back of the Envelope Tank Circuit Fig [9] - Tank Circuit Setup](/software/dso/guide/1.3/80.jpg?m=p)
Fig [9] - "Back of an Envelope" Tank Circuit
It comprises a 470 uH inductor and a 100 nF capacitor configured per the circuit in Fig [8].
When an impulse or step is applied to this circuit it will oscillate at its "resonant frequency".
However because there is actually also some resistance (not shown in Fig [8]) this is in fact an RLC circuit ^ so the oscillation will decay.
Therefore if we set up BitScope's AWG to produce a square wave and plot the result we expect to see a damped sinusoidal waveform.
The frequency of the ringing can be calculated using the standard formula, Fig [10].
![Fig [10] - Resonant Frequency Fig [10] - Resonant Frequency](/software/dso/guide/1.3/77.png?m=p)
Fig [10] - Resonant Frequency
In this case we expect a resonant frequency of 23.2 kHz so we'll set up the waveform generator to produce a square wave about one order of magnitude slower so we can observe a reasonable number of ringing oscillations.
![Fig [11] - AWG Setup Fig [11] - AWG Setup](/software/dso/guide/1.3/79.png?m=p)
Fig [11] - AWG Setup
Fig [11] shows the AWG set up to produce a 4V peak-to-peak square wave at 1.25 kHz.
We've left the Symmetry control at 50% in this case because we're looking at the step response.
![Fig [12] - Loop Button Fig [12] - Loop Button](/software/dso/guide/1.3/81.png?m=p)
![Fig [12] - LOOP and AWG Fig [12] - LOOP and AWG](/software/dso/guide/1.3/82.jpg?m=p)
Fig [12] - LOOP and AWG
If we were interested in the impulse response we'd simply set Symmetry to a small value to synthesize an impulse instead.
Make sure the AWG LOOP button (on the DSO software) is UP.
On the front panel of the BitScope ensure the Waveform Generator switch is DOWN and the 50 ohm terminator is UP.
These settings are shown in Fig [12].
When you enable AWG, both analog channels and the spectrum analyzer you should see a display similar to Fig [13].
![Fig [13] - Tank Circuit Step Response and Transfer Function Fig [13] - Tank Circuit Step Response and Transfer Function](/software/dso/guide/1.3/78.png?m=p)
Fig [13] - Tank Circuit Step Response and Transfer Function
In this screenshot we've disabled the graticule and enabled the measurement cursors.
The green waveform and spectrum display Channel B; the Waveform Generator output.
The yellow waveform and spectrum show Channel A; the Tank Circuit response.
Some features of note are:
The measured results match the theory to within the tolerance of the components used.
This is just one example of how to use BitScope's built-in AWG for transfer function analysis.